Something a little different and wider in scope than Detroit, today.
I wanted to share a report I’ve been working at Regrid called Owned Away From Home.
The report uses Regrid’s nationwide parcel data to look at the share of U.S. housing stock that is owned non-locally — either in another state, or in the same state but in a different zip code.
Nationally we found that 1 in 4 U.S. housing units are owned non-locally:
5% of US housing stock is owned in a state other than the home itself
19.5% is owned in a different zip code within the same state
Read Owned Away From Home here for full interactivity and exploration.
A few images and findings are shared below, too.
Out of State vs. Out of Zip Code Ownership
The specter of institutional investors and Wall Street-backed investors in housing looms large in the media and imagination, and is certainly found concentrated in some Sun Belt cities. To the extent that is coincident with ownership lying out of state, though, it is about 5% of U.S. housing stock (and not all of that is out of state investors — ownership like vacation homes are captured there, too).
Far more common is ownership of housing stock in-state, but in a different zip code, which encompasses 19.5% of U.S. housing stock.

The above dynamic is certainly found in Detroit, too. Though we sometimes hear about creeping out of state ownership, Detroit is in line with the national average for housing stock owned out of state at around 5%. One notable exception is a concentration of Florida-based ownership on the east side, which I’ve written about before:
Far more common here, as in the rest of the country, are homes owned by someone in Michigan, but in a different zip code than the home they own. Although, in the case of Detroit, the share of Detroit housing owned outside the city is actually declining and, increasingly, Detroiters own more of Detroit’s housing — which I’ve written about here in The Chargeback.
Income & Local Ownership
Perhaps not surprising, but certainly dramatic, is the relationship between median household income and local control of housing stock.
The bottom 10% of census tracts by household income have, on average, 42% of their housing stock owned by someone in a different state or different zip code.
The top 10% of census tracts by income have, on average, 16% of housing stock owned by someone in a different state or different zip code.
The Income & Ownership Index
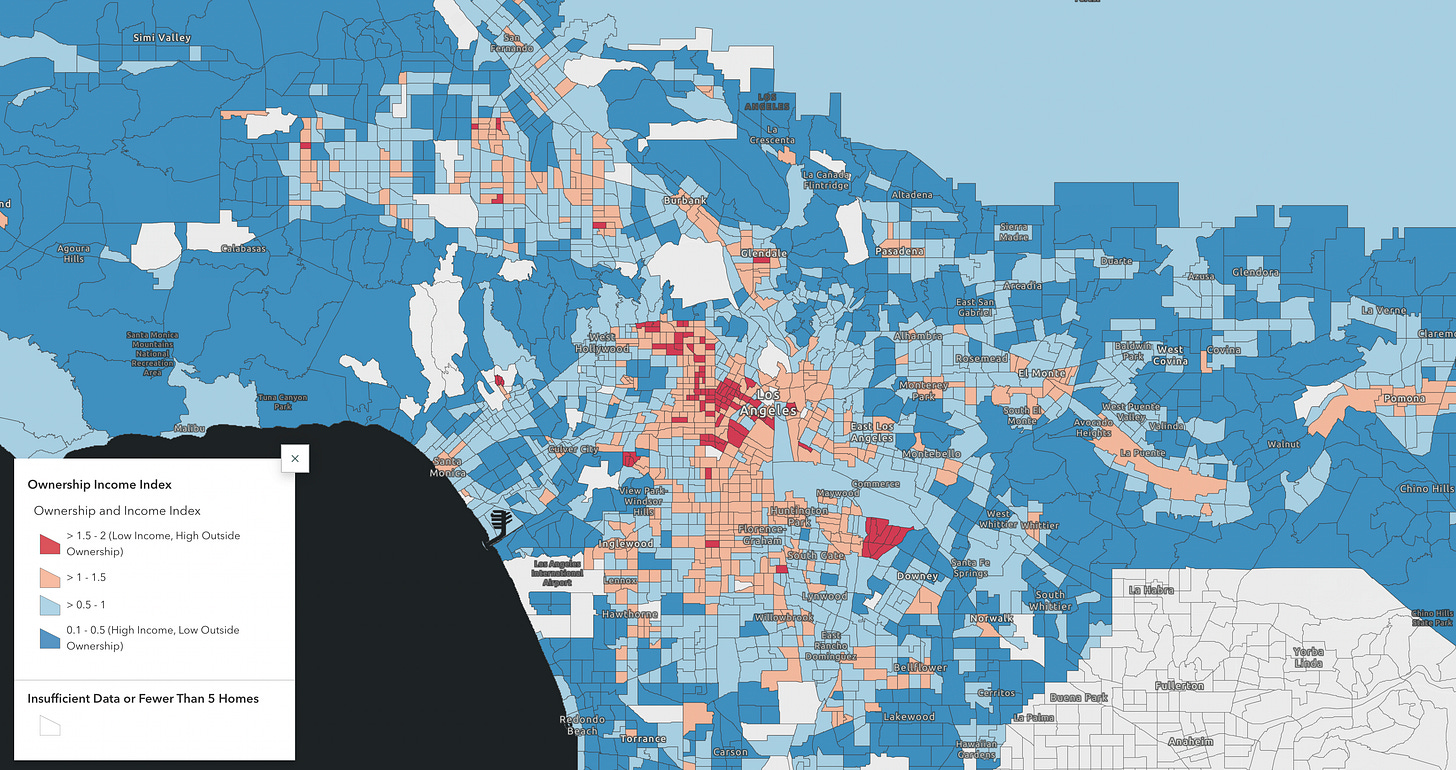
Towards the end of the report you’ll find the Income & Ownership Index. The Index is a simple 0 - 2 point scale on which I score the combined percent of housing, by census tract, owned either out of state or in a different zip code, plus the decile into which that census tract’s median household income falls.
A lower score on the Index indicates high income & high local control of housing.
A high score on the Index indicates low income & low local control of housing.
There’s a lot more I want to do with this index and I found some really fascinating things while exploring it, but it was too much to get into in this initial report. So, more to come there. For now, here are a few areas represented in the Income & Ownership Index.


You were fantastic on the Strong Towns podcast this week. I really appreciate the work you’re doing with geospatial data.
Heard you also on Strongtowns podcast.
Is this analysis able to be replicated for my area within the regrid site?
Curious to see how my struggling town compares.